UNIX Console v3.2

UNIX Console v3.2
A Solaris UNIX system analysis and performance tool
(A GUI interface for UNIX commands)


For Macintosh and Windows

Free upgrade for Version 1.0, 2.0 & 2.5 Registered Users
UNIX Console Overview
UNIX Console is a Solaris UNIX system analysis and performance
tool for Power Macintosh and Windows 9x/NT computers. It consists
of a series of modules that send commands to a remote UNIX server
and displays a graphical interpretation of the results. Many modules
make an analysis of the commands result set and highlight potential
problems and suggest possible options. The modules will never
override the current users access permission level on the server.
Analyses are based on published work.
This application works best with Sun Microsystem's Solaris UNIX, although some modules may work on other platforms. At this stage only Solaris is supported. No non-Solaris server-side components need be installed.
The PDF manual can be downloaded separately
Features include:
- Now runs native under OS X 10.3 and greater
- Many other changes
Many commands require root access.
Login
Use this module to login to the TELNETD server or to change the user ID after successfully logging in. The Server address can be a valid IP number or a fully qualified DNS name. The user ID of the real-time socket is set here. The default port number is set at 23 but can be altered to suit your particular telnet server setup.
The Dumb Terminal module implements a basic 80x24 "Network Virtual Terminal" (NVT). This dumb 'stream editing' module does not emulate a VT100-compatible terminal. It does not allow displaying or editing of server-side documents via more, vi, less and similar full-screen terminal tools. Future versions may attempt to enhance this module. Macintosh users wishing to edit documents should download BetterTelnet and use it in parallel to UNIX Console. Backspace, Copy and Paste are supported, as are the HOME, END, Page Up and Page Down keys on the Macintosh platform.
This module lists all users present in /etc/passwd. Double clicking a user will reveal the details for the last five logins. The security popupmenu allows four sub-tasks to be executed: "Show ROOT logins"; "Logins with no passwords"; "All system logins"; and "Logins with duplicate user ID's. The results are displayed in the same listbox. The last three security commands require root access.
Print jobs in BSD printer spools are displayed in the "BSD Spools" module. The status of print jobs can be determined by double clicking the print spool in the BSD listbox, or selecting the appropriate print spool and clicking the "Show" button.
Print jobs can be only stopped by root or the user who owns the print job. Normal UNIX permission's are not over-ruled.
Three modules are presented: Space; I/O Graph; and I/O History.
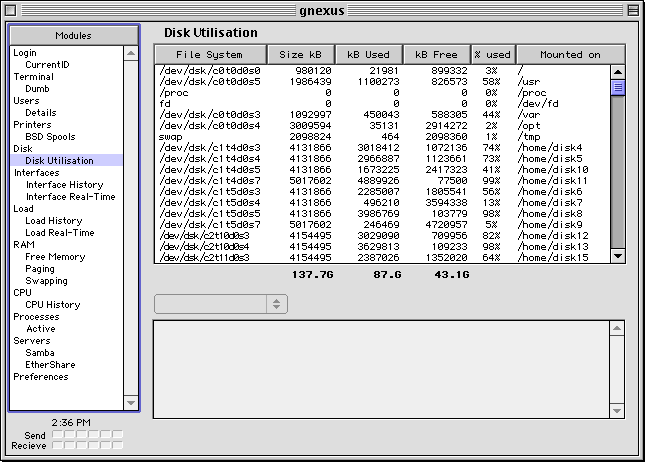
The Space module lists the usage statistics for disks connected to the server (Figure 1). This module calculates the total capacity of the disks on the server, the total used space as well as the total free disk space remaining. Each column can be sorted by clicking the appropriate listbox heading. This is a very convenient way to find the most full disks. After selecting a disk from the listbox, the Analysis popup menu will allow further actions to be taken. This popup menu will display the users that have home directories on the selected disk, or alternatively the largest (or just the top five) users of disk space on this disk. Double clicking a row will automatically reveal the users who have home directories on this hard disk.
The Disk I/O History module will display the average access time (in ms) since boot time for each hard disk. The 'percentage busy' for each disk is also presented. Double click a disk to drill down to reveal the average access time for each disk slice.
The Disk I/O Graph module is a real-time data graphing tool. The data is collected by the real-time socket. The Disk I/O module displays a colour coded, real-time bar chart of current 'access time (in ms)' and 'percentage busy' for each disk.
This section provides two interface modules, "I/O Graph" and "I/O History".

The I/O History module lists a summary of eight separate packet metrics since boot (Figure 2). These metrics (Packets In, Packets In with Errors, Packets Out, Packets Out with Errors, Number of Collisions, Percentage Collisions, Percentage Utilisation, and Overall Analysis) record the number of packets received and sent for each interface as well as the total number of packets with errors. Furthermore the percentage of error packets for each interface is calculated and an analysis of the state of the interface is presented. The percentage of collisions for each interface is also calculated. This is an indication of the overall health of the network. Note that the collision metrics are irrelevant for non-ethernet interfaces.
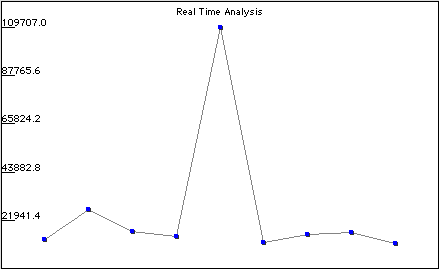
I/O graph is a real-time analysis and performance module (Figure 3). Seven metrics are recorded or calculated for each interface (Packets In, Packets In with Errors, Packets Out, Packets Out with Errors, Number of Collisions, Percentage Collisions, Percentage Utilisation) and each metric can be graphically displayed. Each line bar graph is colour coded. If a value of a metric is within normal bounds, the plotted node is coloured blue. As it approaches a more unfavourable value, it gets plotted red. For example, if the percentage of collisions is greater then 15% then the node being displayed in full red and extra warning is presented in the analysis text box as well.
If the interface is in full-duplex mode the Collisions column should always be 0%. The Percentage Utilisation result is an approximate calculation of the actual usage of an ethernet interface as a percentage of the theoretical maximum throughput. This is an indication of the capacity of the interface to handle the ethernet traffic.
This section provides two modules, "Graph" and "History". The History module displays the average load for the server for time a console settings file has been saved. In effect, it is this console files history of load averages. The Graph module is a real-time analysis of the load on the system and as such this graph is updated whilst the connection is active. The graph is colour coded. If the load is considered to be high the nodes become red.
This section provides four modules: "Usage"; "History"; "Paging"; and "Swapping".
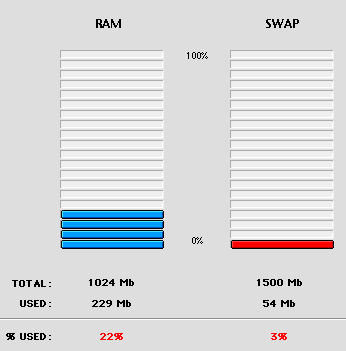
The Usage module will present two LED thermometers displaying the percentage usage for each metric (Figure 4). The total RAM and SWAP available to the system will be calculated and displayed.
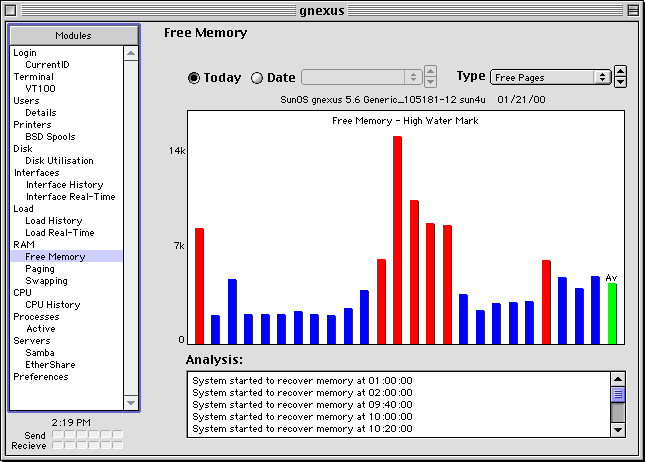
The History (Figure 5), Paging and Swapping modules display Bar graphs for data recorded by the System Accounting and Reporting daemon (SAR). SAR must be configured for these modules to display this historical information. On Solaris, SAR is already installed and is relatively easy to configure.
If SAR is configured as described in the File System Administration Manual, there will be a report each day that can be browsed by these three modules.
The CPU History module also displays SAR data in a bar chart form, similar to the RAM History, Paging and Swapping modules. An analysis of the data is presented below the chart.
The Process module lists the current process table. Processes can be sent the HUP or KILL signals. The HUP signal has become the standard call for a process to re-read it's configuration file or otherwise take notice of changed settings that may affect it progress. The KILL button sends a KILL -9 signal which will tell the process to stop immediately and quit execution. Normal UNIX permissions apply. UNIX Console never over-rides the current users normal permission levels.
This Section has two modules, SAMBA and EtherShare.
SAMBA is a free and open source SMB/CIFS server that runs on UNIX-like operating systems. This module lists the currently connected Windows clients. Short messages can be sent to these SMB clients. The clients need the WinPopup.exe application to be running for the messages to be detected. Clients do not acknowledge receipt of the messages.

EtherShare is the premier Apple File Protocol (AFP) and Print Spool Server for UNIX and LINUX systems from Helios, Germany. This module (Figure 6) will list all AFP clients (even those Macintosh clients connected via AFP over IP) as well as PCShare clients.
This module allows short message to be sent to Macintosh clients. No client side applications need to be running; the message is immediately visible as a modal dialog that the user must dismiss before proceeding. The Desktop Database for users home directories can be easily rebuilt by selecting the user in the listbox and clicking the "Rebuild" button.

The EtherShare also displays the volumes (ie 'Shares') presented by the EtherShare server (Figure 7). Double clicking a server will reveal all the users who are currently connected to this volume. The Desktop Database for volumes can be rebuilt by selecting the volume in the listbox and clicking the "Rebuild" button.
Dr Gerard Hammond
MacSOS, Australia, 2003.
Copyright
UNIX Console is © MacSOS, Australia, 2000-2003.
UNIX Console was written in the brilliant REALbasic available
from http://www.realsoftware.com/
History
v1.0
Released 21 Jan. 2000.
History
v2.0
Released April 2000.
v2.5
Released 26 June 2000.
v2.6
Released 26 June 2000.
v2.7
Released 9 May 2003
v3.2
Released 3 December 2004
Future Versions
- Allow read-write file access instead of the current read-only
file browsing capabilities.
- More security options
- VT100 terminal to replace the dumb terminal.
- ssh protocol
- inetd security analysis module.
- Increase the analysis reporting and strengthen the recommendations
- Web log statistics module.
- File browser and file manager modules with write access.
- GUI File Editor (Macintosh like not vi like).
- syslogd faults browser.
- FTP module
- File permission editor.
- Group information display window
-crontab editor window
-Folder/File move/delete/copy/duplicate commands
-User add/delete commands
Dr Gerard Hammond
MacSOS, Australia, 2004.
UNIX Console is copyright 1999-2004 by MacSOS.
MacSOS
Software License Agreement