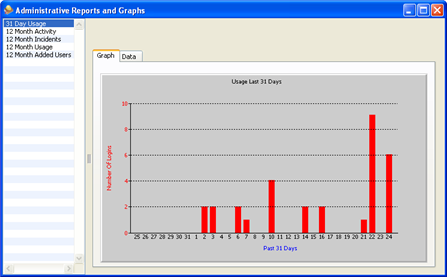
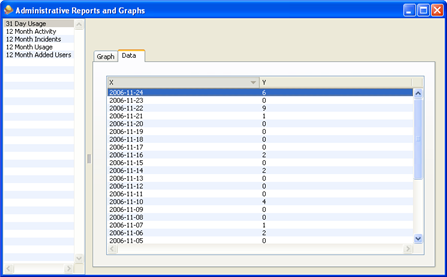
Various graphical reports are available for viewing. The graphical portion of the report can be selected and copied to another application or image editing software. The data portion of report can be exported to a text file for use in your own spreadsheet or graphic software such as Microsoft Excel or Open Office. This window is accessible from > .

Select from one of the reports on the left side menu. The current reports are listed below.
31 Day Usage
12 Month Activity
12 Month Incidents
12 Month Usage
12 Month Added Users
You may also view the raw data of each graph by clicking on the tab of the selected report.

